OnTarget™ Feature

Know Your Chance of Success

Roth IRA Balance
Try moving the slider

Test your retirement plan against 153 years of real market history. See exactly how your plan would have performed through every crash, every boom, and every market cycle since 1871.

Start Your Plan

Single-number projections are misleading

Most retirement calculators tell you a single number: "You'll have $2.1 million at retirement." But that assumes markets return exactly 7% every year. They don't.

What if you retire right before a crash? What if inflation spikes? What if the next decade looks like 2000-2010 instead of 2010-2020?

A single number gives false confidence. You need a range of outcomes.

Simple Calculator
$2.1M
Assumes 7% every year
vs
ReadyAimRetire
87% Success
$800K – $4.2M range
Portfolio chart with percentile bands

Stress-test against real market history

Instead of guessing what markets might do, we test your plan against what markets actually did. Every month. Every year. Since 1871.

  • The Great Depression (1929-1932)
  • Oil Crisis & Stagflation (1973-1974)
  • Dot-com Crash (2000-2002)
  • Financial Crisis (2008-2009)
  • COVID Crash (2020)

If your plan survives history's worst, you can retire with confidence.

See Your Success Rate

More than just pass or fail

Success isn't binary. Some plans end with surplus. Others cut it close. ReadyAimRetire shows you the full distribution of outcomes across all historical scenarios.

Surplus
End with 150%+ of starting balance
On Track
End with healthy remaining funds
Tight Finish
Money depletes near the end
Ran Out
Money depletes with years remaining

See exactly where your plan falls – and adjust until you're comfortable with the risk.

Outcome distribution visualization
Control which history to test

Control which history to test

Not everyone wants the same level of conservatism. With the dual-handle year range slider, you decide which historical periods to include in your test.

  • Conservative: Test 1871-2024 (includes all crashes)
  • Moderate: Test 1950-2024 (post-WWII era)
  • Recent: Test 1990-2024 (modern markets)

See exactly how many simulations run and which events are included.
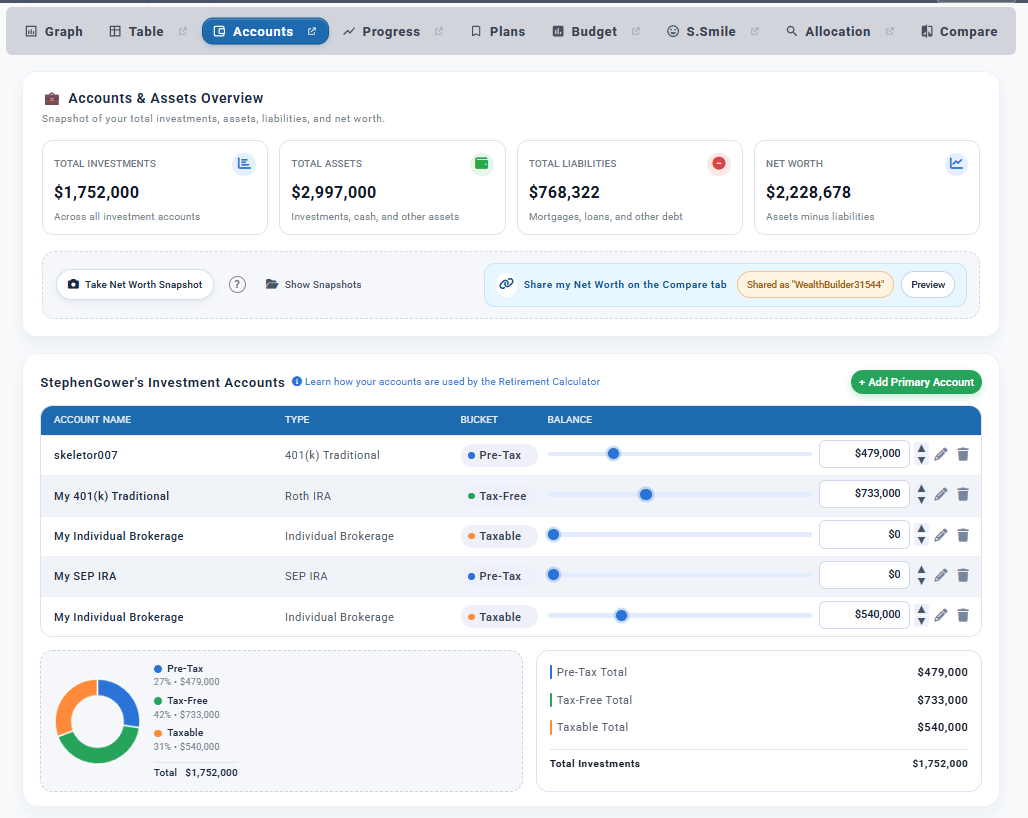
Customize Your Test

Not a simplified calculator

Each simulation runs your complete retirement plan with full integration of taxes, benefits, and withdrawal strategies. This isn't a back-of-napkin estimate.

  • Full tax integration: Federal brackets, state taxes, IRMAA
  • Social Security timing: Optimal claiming strategy impact
  • Pension coordination: Multiple income sources modeled
  • Withdrawal optimization: Tax-aware account sequencing
  • RMD calculations: Required distributions included
  • Monthly granularity: Not annual approximations
See the Full Picture
Full tax and benefit integration

Built on evidence, not assumptions

153+
Years of Market Data
Real returns from 1871 to today
150+
Simulations Per Plan
Every historical starting year tested
5
Major Crashes Included
1929, 1973, 2000, 2008, 2020
Monthly
Calculation Granularity
Not annual approximations

How it works

1

Enter Your Plan

Add your portfolio, income sources, spending, and retirement goals.

2

Run the Test

We simulate your plan through 150+ historical market periods.

3

See Your Odds

Get your success rate, outcome distribution, and ending balance ranges.

4

Adjust & Optimize

Tweak spending, timing, or allocation until you reach your target confidence.

Stop guessing. Start knowing.

Run your retirement plan through 153 years of market history and see your true probability of success.

Confidence comes from evidence, not assumptions.

Confident retirement planning
153+
Years of real market data to test your plan against.
Every crash. Every boom. Every cycle since 1871.
Historical accuracy
150+ simulations
Real crash testing
Evidence-based confidence

Take aim at your retirement with OnTarget

Sign up today and start building the financial plan you deserve. It's free to get started!

Get Started